Python 中的 random.gammavariate() 方法生成遵循 Gamma 分布的随机数。Gamma 分布是连续概率分布的双参数系列,取决于两个正参数 alpha (α) 和 beta (β) 的值,这两个参数都必须大于 0。
Gamma 分布的概率密度函数 (PDF) 由下式给出 -
x ** (alpha - 1) * math.exp(-x / beta)
pdf(x) = --------------------------------------
math.gamma(alpha) * beta ** alpha
参数 alpha (α) 定义分布的形状。α 值越大,分布越分散。其中,参数 beta (β) 定义分布的尺度。它会影响数据点在平均值周围的分布。
语法
以下是 gammavariate() 方法的语法 -
random.gammavariate(alpha, beta)
参数
此方法接受以下参数 -
- alpha:这是 Gamma 分布的形状参数,它必须大于 0。
- beta:这是 Gamma 分布的 scale 参数,它也必须大于 0。
返回值
此方法返回一个遵循 Gamma 分布的随机数。
示例 1
让我们看一个使用 random.gammavariate() 方法从形状参数为 2 和尺度参数为 3 的 Gamma 分布中生成随机数的基本示例。
import random
# Parameters for the gamma distribution
alpha = 2
beta = 3
# Generate a gamma-distributed random number
random_number = random.gammavariate(alpha, beta)
print("Generated random number:", random_number)
以下是输出 -
Generated random number from gamma distribution: 7.80586421115812
注意:由于程序的随机性,每次运行程序时生成的 Output 都会有所不同。
示例 2
此示例使用此方法生成一个包含 10 个随机数的列表,该随机数遵循 Gamma 分布。
import random
# Parameters for the gamma distribution
alpha = 3
beta = 1.5
result = []
# Generate a random numbers from the gamma distribution
for i in range(10):
result.append(random.gammavariate(alpha, beta))
print("List of random numbers from Gamma distribution:", result)
在执行上述代码时,您将获得如下所示的类似输出 -
List of random numbers from Gamma distribution: [1.8459995636263633, 1.5884068672272527, 2.472844073811172, 5.9912332880010375, 5.710796196794566, 7.0073286403252535, 0.6174810186947404, 2.3729043573117172, 3.5488507756541923, 4.851207589108078]
示例 3
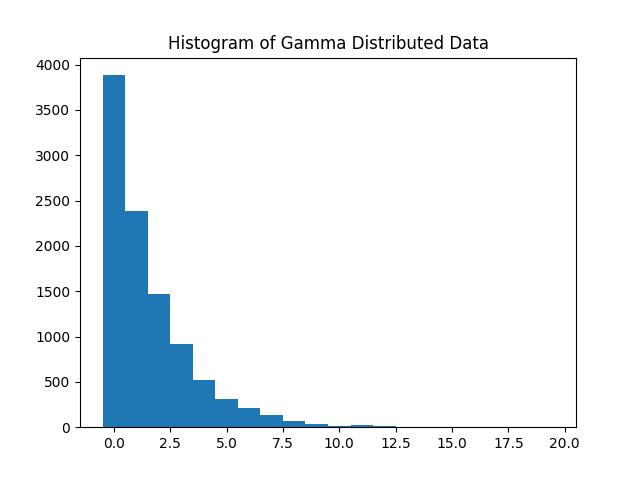
这是另一个示例,它使用 random.gammavariate() 方法生成并显示一个直方图,显示来自 Gamma 分布的数据分布。
import random
import numpy as np
import matplotlib.pyplot as plt
# Parameters for the gamma distribution
alpha = 1
beta = 2
# Generate gamma-distributed data
d = [random.gammavariate(alpha, beta) for _ in range(10000)]
# Create a histogram from the generated data, with bins up to the maximum value in d
h, b = np.histogram(d, bins=np.arange(0, max(d)+1))
# Plot the histogram to visualize the distribution
plt.bar(b[:-1], h, width=1, edgecolor='none')
plt.title('Histogram of Gamma Distributed Data')
# Display the plot
plt.show()
上述代码的输出如下 -
