Python 中的 random.expovariate() 方法生成遵循指数分布的随机数。指数分布是一种连续概率分布,通常用于对泊松过程中事件之间的时间进行建模。它的特征是参数 lambda,即 rate 参数。
参数 lambda 是 1.0 除以所需的分布均值。如果 lambda 为正数,则函数返回从 0 到正无穷大的值,表示事件之间的时间。如果 lambda 为负数,它将返回从负无穷大到 0 的值。
语法
以下是 expovariate() 方法的语法 -
random.expovariate(lambda)
参数
此方法接受单个参数 -
- lambda:这是指数分布的 rate 参数。
返回值
此方法返回随机数,该随机数遵循具有指定速率的指数分布。
示例 1
让我们看一个使用 random.expovariate() 方法生成单个随机数的基本示例。
import random
# Lambda for the Exponential distribution
lambda_ = 2
# Generate a random number from the Exponential distribution
random_value = random.expovariate(lambda_)
print("Random value from Exponential distribution:", random_value)
以下是输出 -
Random value from Exponential distribution: 0.895003194051671
注意:由于程序的随机性,每次运行程序时生成的 Output 都会有所不同。
示例 2
此示例使用 random.expovariate() 方法生成 10 个间隔时间,平均速率为每秒 15 个到达。
import random
# Lambda for the Exponential distribution
rate = 15 # 15 arrivals per second
# Generate a random numbers from the Exponential distribution
for i in range(10):
interarrival_time = random.expovariate(rate)
print(interarrival_time)
在执行上述代码时,您将获得如下所示的类似输出 -
0.05535939722671001
0.0365294773838789
0.0708190008748821
0.11920422853122664
0.014966394641357258
0.05936796131161308
0.09168815851495513
0.18426575850779056
0.03533591768827803
0.08367815594819812
0.0365294773838789
0.0708190008748821
0.11920422853122664
0.014966394641357258
0.05936796131161308
0.09168815851495513
0.18426575850779056
0.03533591768827803
0.08367815594819812
示例 3
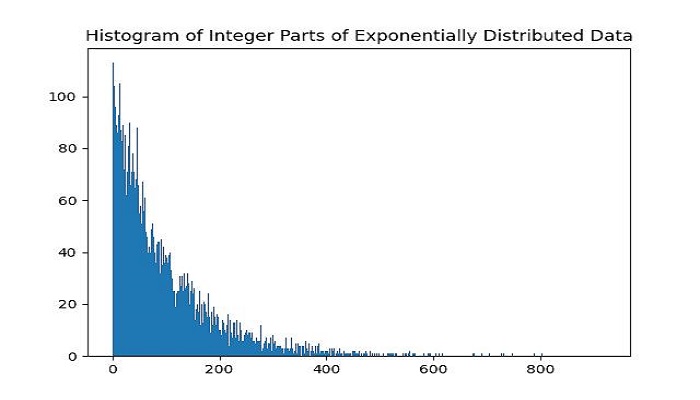
这是另一个示例,它使用 random.expovariate() 方法生成并显示一个直方图,该直方图显示了 rate 参数为 100 的指数分布中样本的整数部分的频率分布。
import random
import numpy as np
import matplotlib.pyplot as plt
# Generate 10000 samples from an exponential distribution with rate parameter of 100
rate = 1 / 100
num_samples = 10000
# Generate exponential data and convert to integers
d = [int(random.expovariate(rate)) for _ in range(num_samples)]
# Create a histogram of the data with bins from 0 to the maximum value in d
h, b = np.histogram(d, bins=np.arange(0, max(d)+1))
# Plot the histogram
plt.bar(b[:-1], h, width=1, edgecolor='none')
plt.title('Histogram of Integer Parts of Exponentially Distributed Data')
plt.show()
上述代码的输出如下 -
