Python random.paretovariate() 方法生成遵循帕累托分布的随机数。它是一种幂律概率分布,也称为“80-20 规则”。
这种分布通常用于社会科学、质量控制、金融和自然现象。它取决于名为 alpha 的形状参数,该参数决定了分布的行为。
这个函数不能直接访问,所以我们需要导入 random 模块,然后我们需要使用 random 静态对象调用这个函数。
语法
以下是 paretovariate() 方法的语法 -
参数
此方法接受单个参数 -
- alpha:这是 Pareto 分布的形状参数。
返回值
此方法返回遵循 Pareto 分布且具有指定 alpha 的随机数。
示例 1
让我们看一个使用 Python random.paretovariate() 方法生成单个随机数的基本示例。
以下是输出 -
Random value from Pareto distribution: 1.101299278142964
注意:由于程序的随机性,每次运行程序时生成的 Output 都会有所不同。
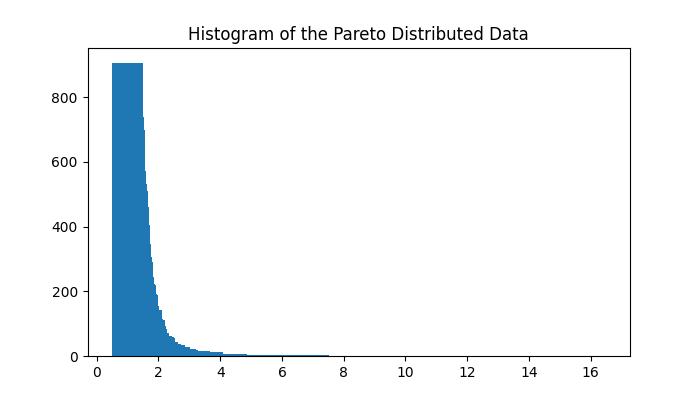
示例 2
下面是一个示例,它使用 random.paretovariate() 方法生成并显示一个直方图,该直方图显示形状参数为 3 的 Pareto 分布中样本的频率分布。
上述代码的输出如下 -
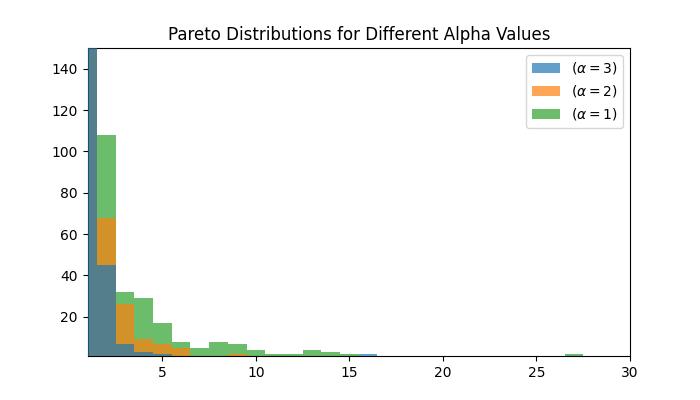
示例 3
此示例生成并绘制不同 alpha 值的 Pareto 分布数据,以使用 random.paretovariate() 方法显示分布如何随 shape 参数的变化。
在执行上述代码时,您将获得如下所示的类似输出 -