Python random.lognormvariate() 方法


Python 中的 random.lognormvariate() 方法生成遵循对数正态(对数正态)分布的随机数。此分布是随机变量的连续概率分布系列,其对数呈正态分布。

它取决于两个参数 mu sigma,其中 mu 是平均值,sigma 是基础正态分布的标准差。

对数正态分布通常用于自然科学、工程、医学、经济学和其他领域。

这个函数不能直接访问,所以我们需要导入 random 模块,然后我们需要使用 random 静态对象调用这个函数。

语法

以下是 lognormvariate() 方法的语法 -


 random.lognormvariate(mu, sigma)

参数

Python random.lognormvariate() 方法采用两个参数 -

  • mu:这是基础正态分布(对数正态分布的自然对数)的平均值。它可以采用任何实际价值。
  • sigma:这是基础正态分布的标准差。它必须大于零。

返回值

这个 random.lognormvariate() 方法返回一个遵循 Log 正态分布的随机数。

示例 1

让我们看一个使用 random.lognormvariate() 方法从均值为 0 且标准差为 1 的正态分布中生成随机数的基本示例。


import random

# mean
mu = 0 	
# standard deviation
sigma = 1 	

# Generate a log normal-distributed random number
random_number = random.lognormvariate(mu, sigma)

# Print the output
print("Generated random number from log normal distribution:",random_number)

以下是输出 -

Generated random number from log normal distribution: 9.472544796309364

注意:由于程序的随机性,每次运行程序时生成的 Output 都会有所不同。

示例 2

此示例使用 random.lognormvariate() 方法生成一个包含 10 个随机数的列表,该列表遵循对数正态分布。


import random

# mean
mu = 0

# standard deviation
sigma = 0.5 	

result = []

# Generate a list of random numbers from the log normal distribution
for i in range(10):
	 	 result.append(random.lognormvariate(mu, sigma))

print("List of random numbers from log normal distribution:", result)

在执行上述代码时,您将获得如下所示的类似输出 -

List of random numbers from log normal distribution: [0.500329149795808, 1.7367179979113172, 0.5143664713594474, 0.5493391936855808, 1.3565058546966193, 1.4841135680348012, 0.5950837276748621, 0.8880005878135713, 1.0527856543498058, 0.7471389015523113]

示例 3

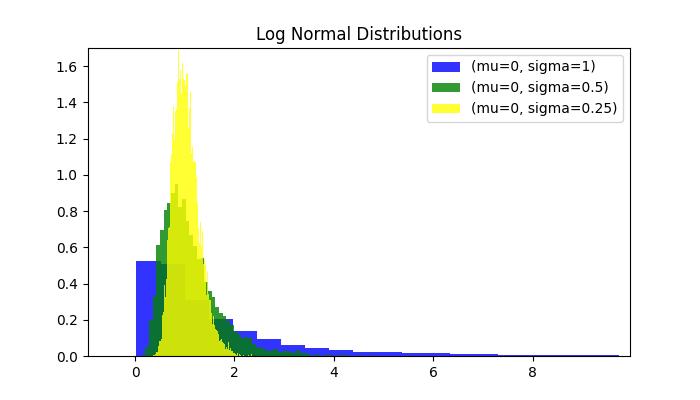
这是另一个使用 random.lognormvariate() 方法的示例,它演示了更改平均值和标准差如何影响正态分布的形状。


import random
import matplotlib.pyplot as plt

# Define a function to generate and plot data for a given mu and sigma
def plot_log_norm(mu, sigma, label, color):

	 	 # Generate log normal-distributed data
	 	 data = [random.lognormvariate(mu, sigma) for _ in range(10000)]

	 	 # Plot histogram of the generated data
	 	 plt.hist(data, bins=100, density=True, alpha=0.8, color=color, label=f'(mu={mu}, sigma={sigma})')

fig = plt.figure(figsize=(7, 4))

# Plotting for each set of parameters
plot_log_norm(0, 1, '0, 1', 'blue')
plot_log_norm(0, 0.5, '0, 0.5', 'green')
plot_log_norm(0, 0.25, '0, 0.25', 'yellow')

# Adding labels and title
plt.title('Log Normal Distributions')
plt.legend()

# Show plot
plt.show()

上述代码的输出如下 -

随机对数变量法